 copyright © Michel Mitri, Story Analyzer LLC
Contact us
How did SA created the Bible dashboard? Who helped?
copyright © Michel Mitri, Story Analyzer LLC
Contact us
How did SA created the Bible dashboard? Who helped?
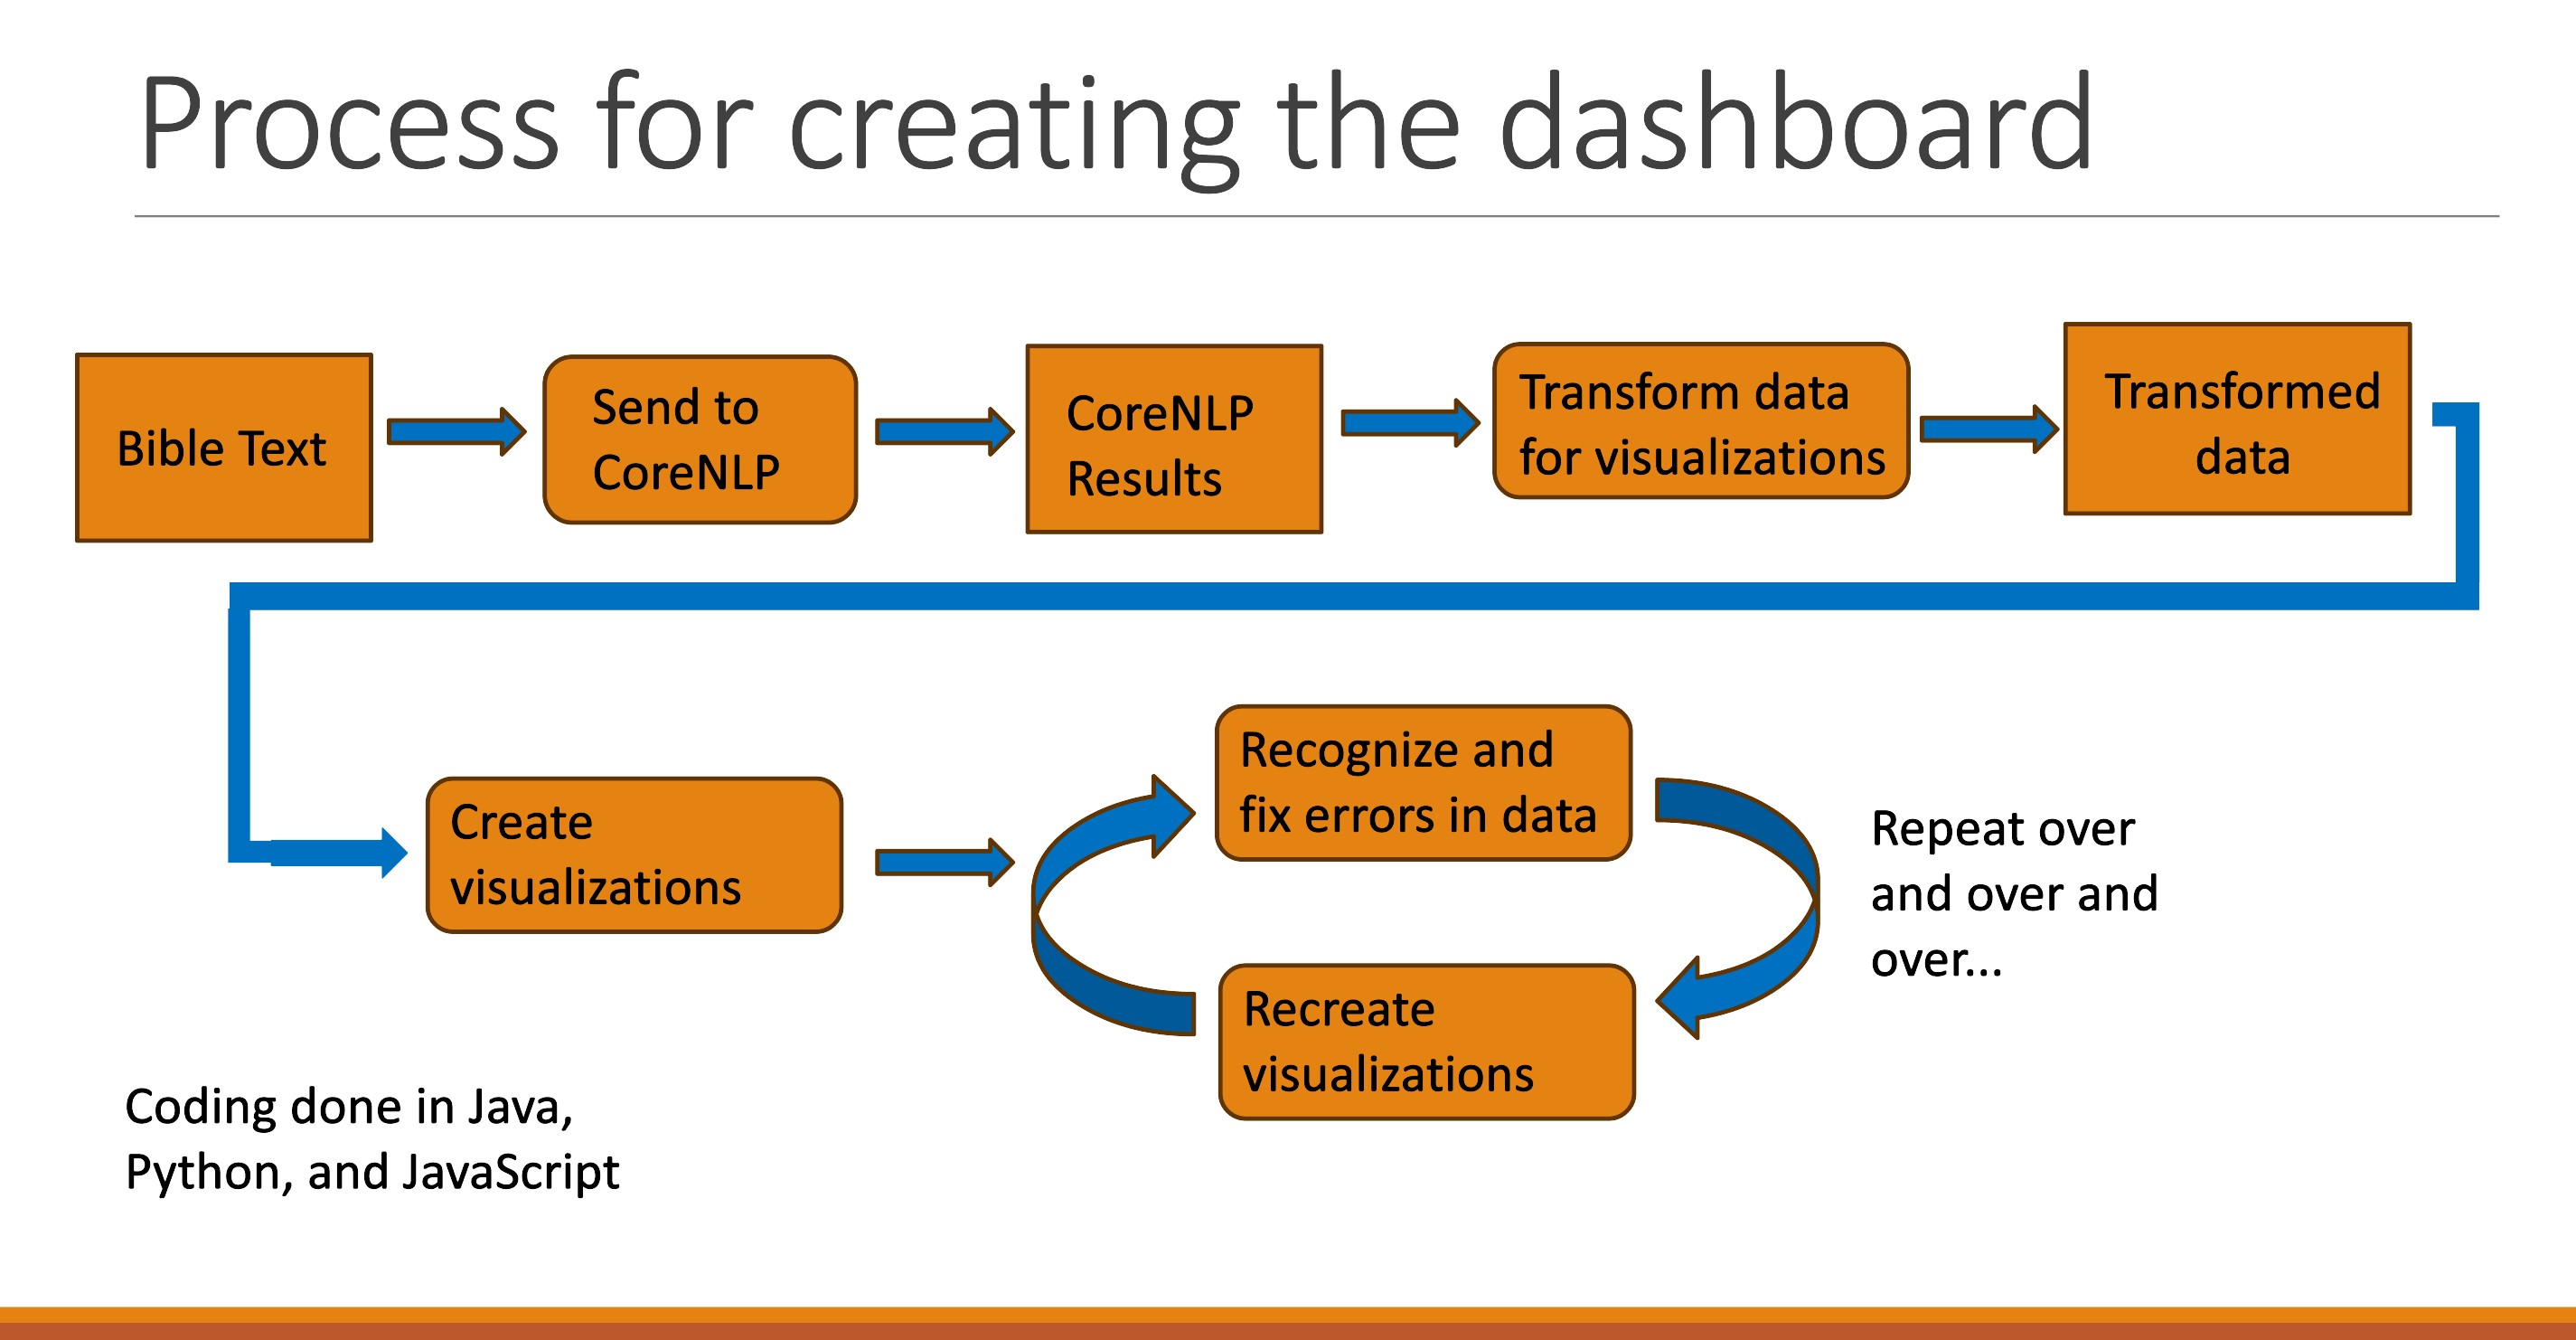
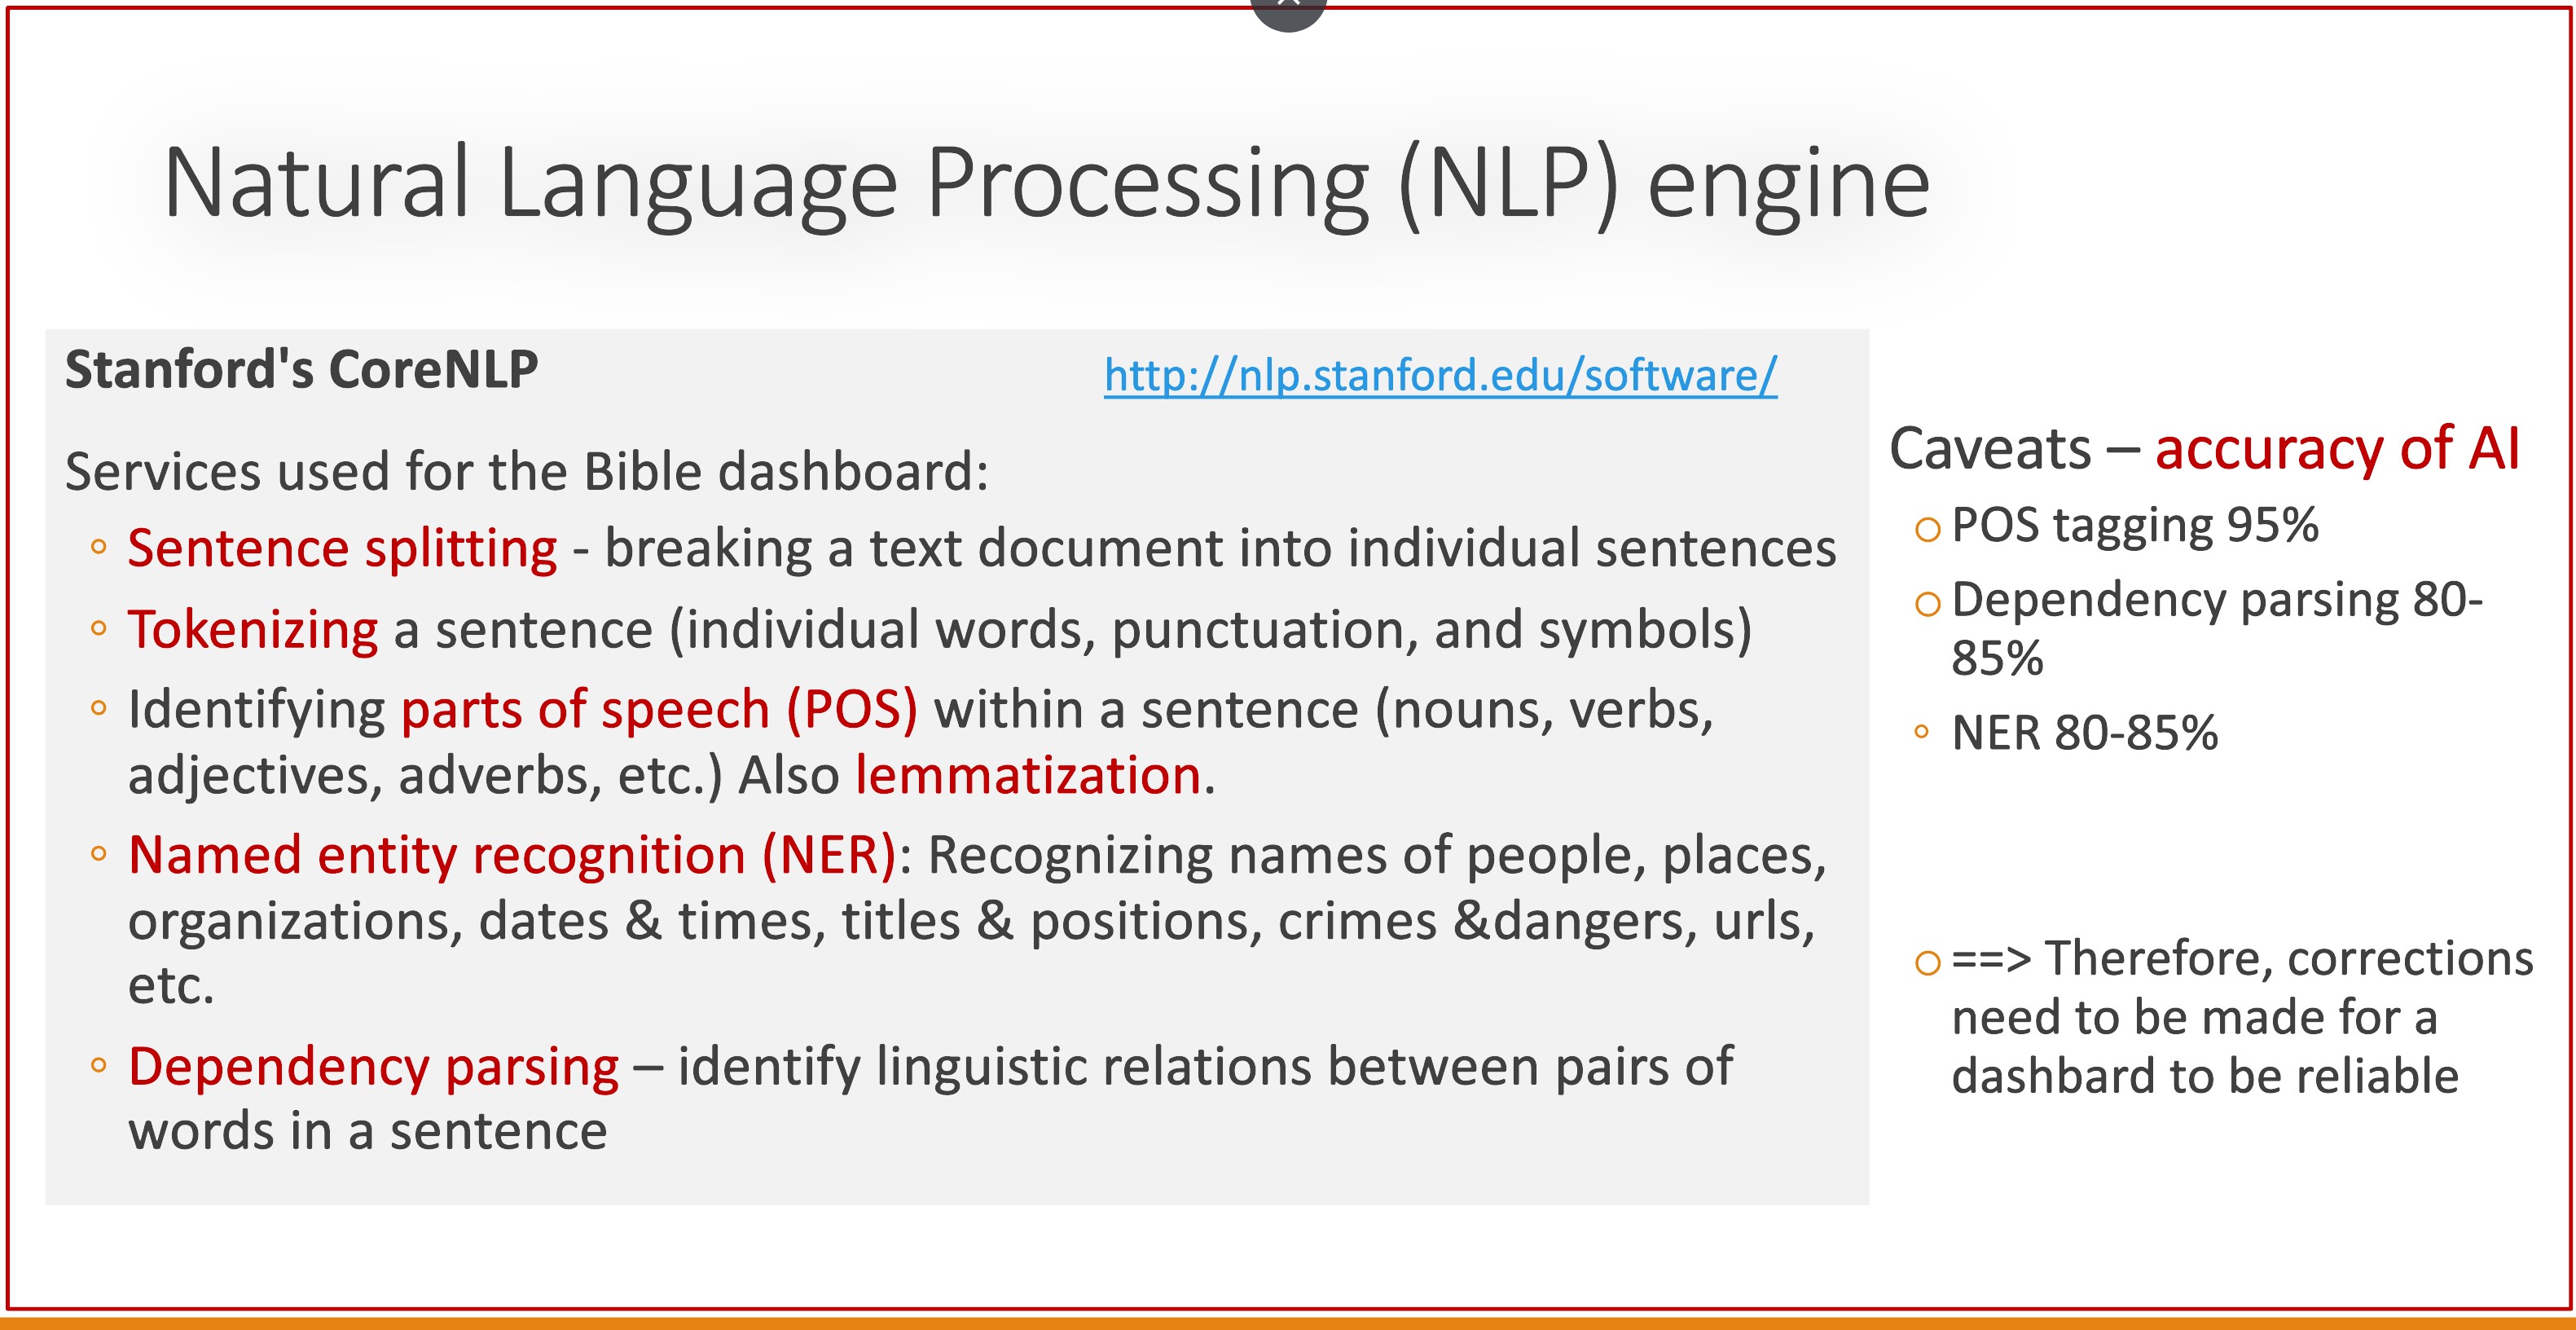
I started with the text of the Bible, which I got from Open Bible from Bible Hub Then I sent it to through the natural language processing engine, CoreNLP (described below). Then I transformed the data so it could be processed through the visualization software (also described below). Then came the laborious process of data corrections, fine-tuning the results, and adding features to the dashboard. It's a never-ending task.
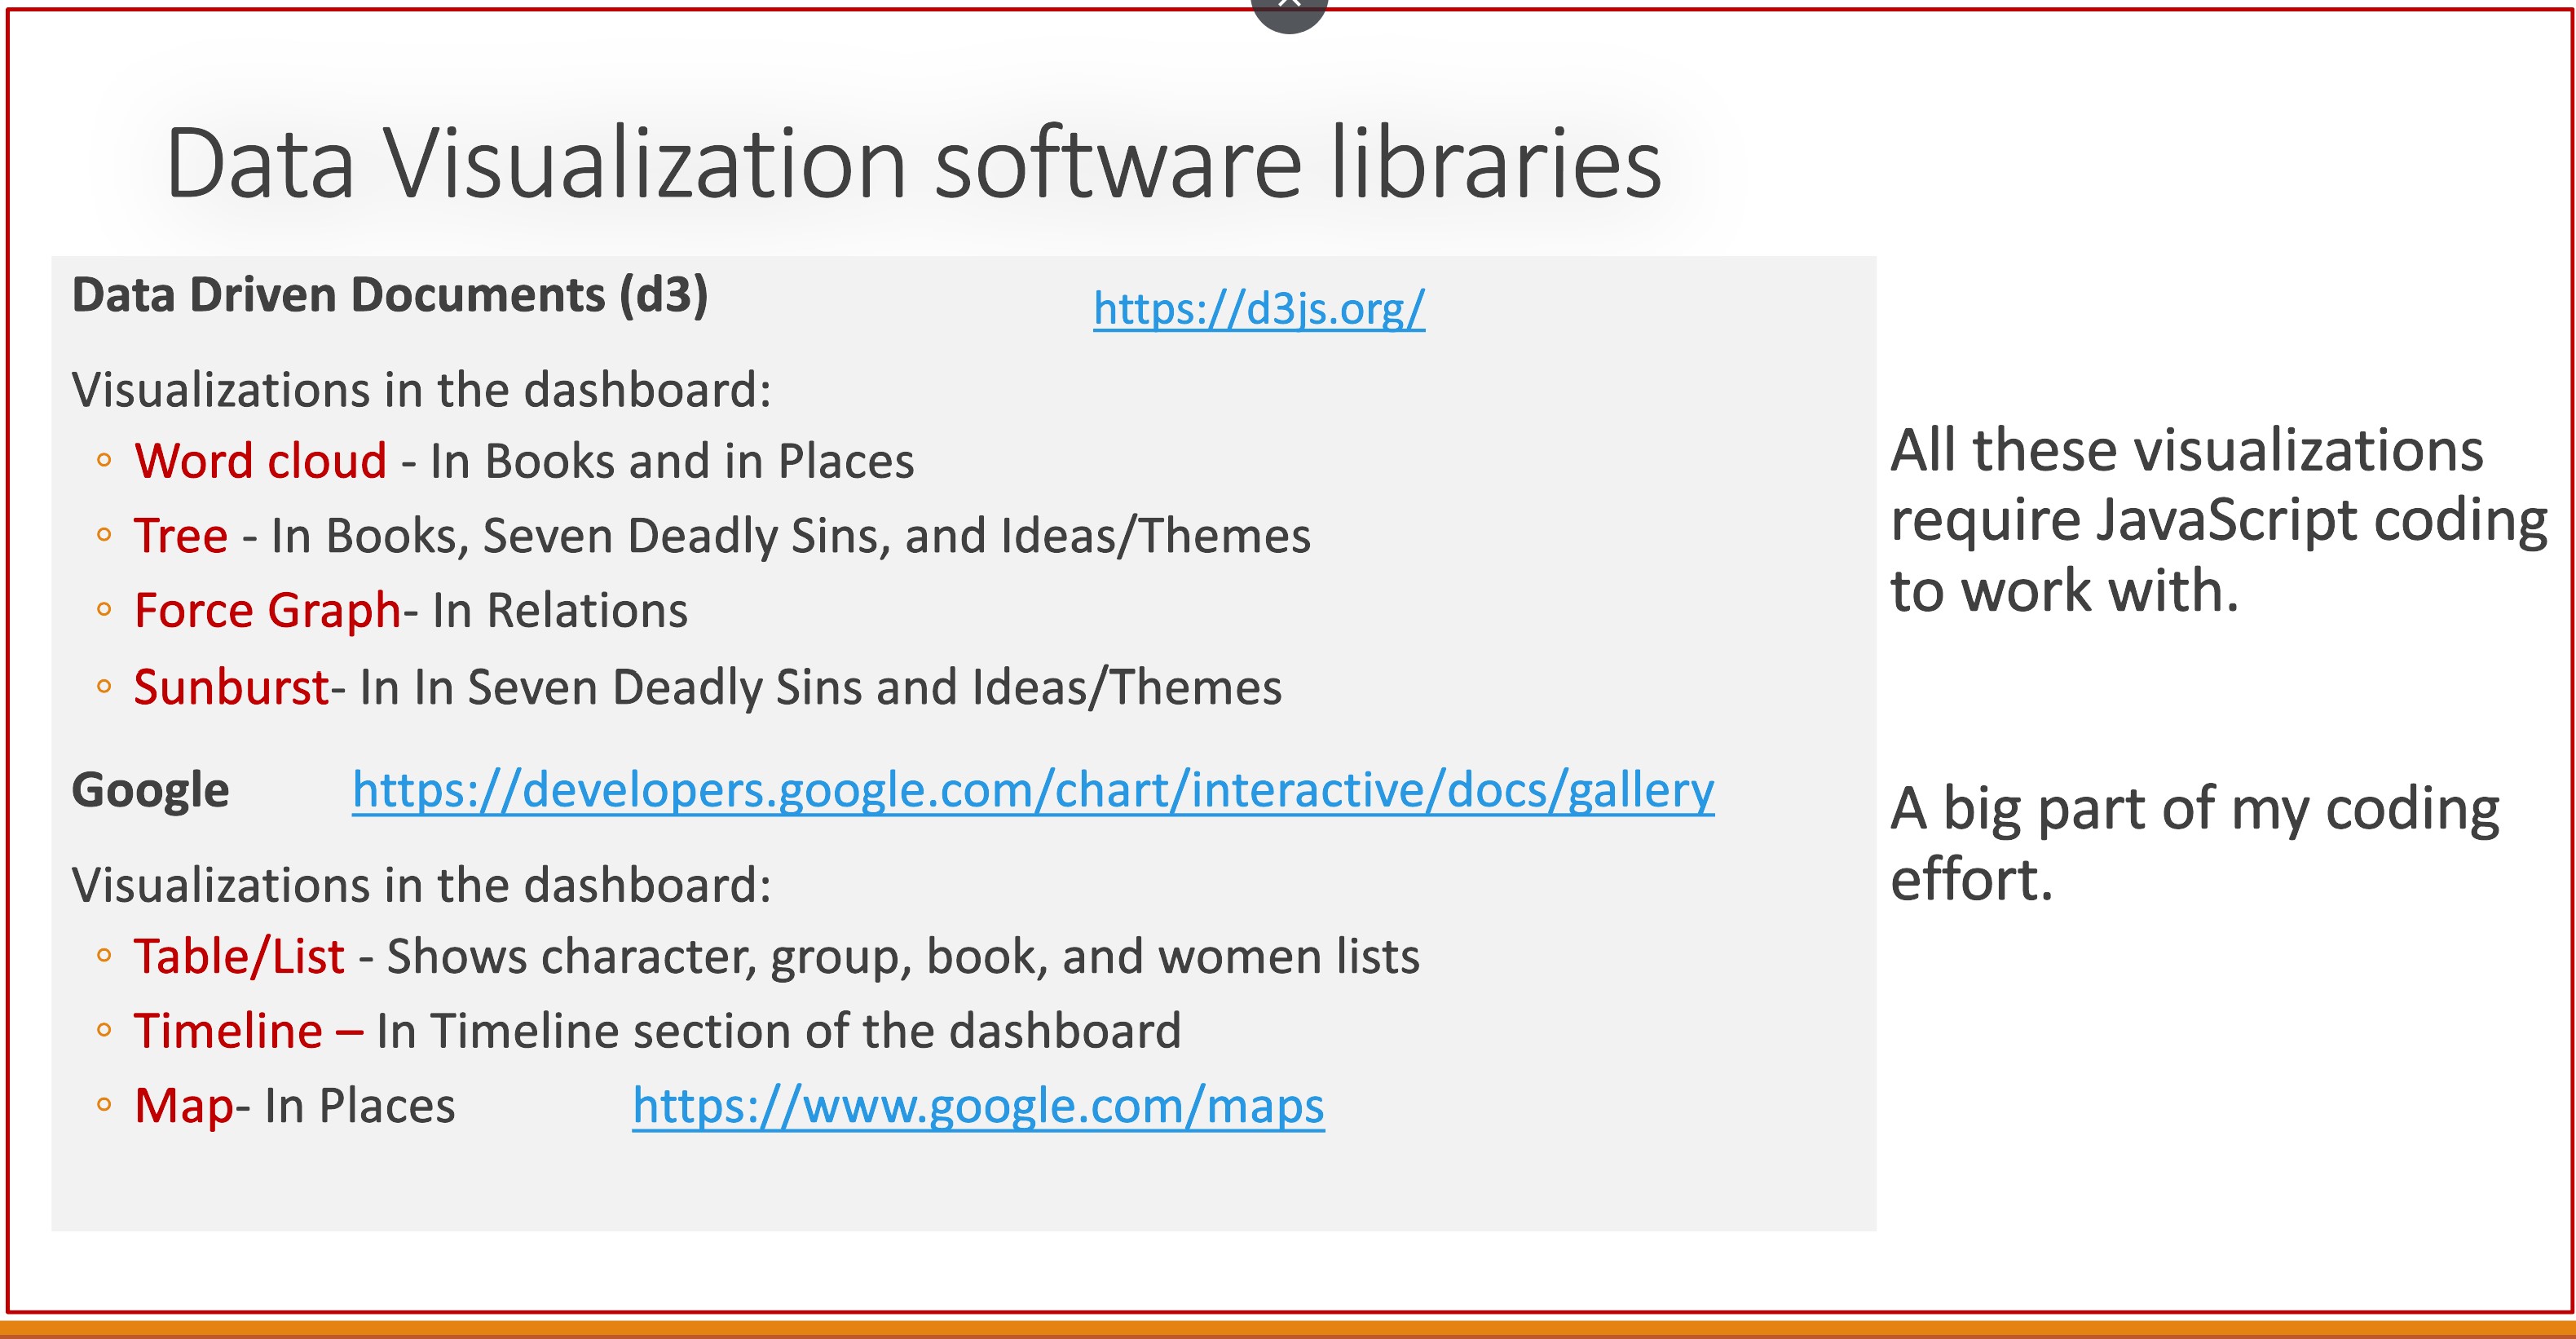
The interactive visualizations are created through
Data Driven Documents (d3)
visualizations, Google charts and Google maps.
Obviously, we start with the Bible itself. See this text file.
A lot of my research was done via Wikipedia, which has tons of articles about biblical characters, places, and the biblical canon. As you can see by perusing the dashboard, I incorporate links to many of these sources.
For the information depicting the approximate Bible's timeline in Story Analyzer's dashboard, and some themes of various sections of old- and new-testament books, I used three main websites: Dan's Faithweb, the Colorado District Church of the Nazarene, and Bible Hub. In particular, Bible Hub's Open Bible website is a rich source for anyone interested in studying the bible.
Of course, the web is replete with sources of biblical scholarship, commentary, and other media. The above stuff is what I used for my dashboard, which I like to consider as another lens on looking at the Bible. Thanks for the efforts of all the folks who preceded me.